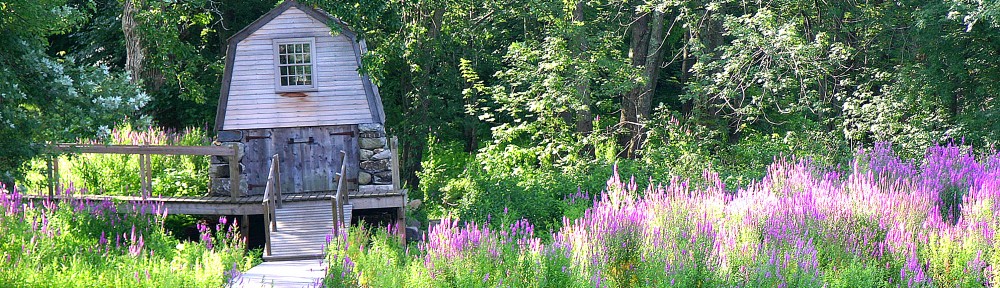
Figure 1 – An image illustrating the concept of contrast. The LHS is at relatively low contrast, the RHS at relatively high contrast. From the Wikimedia Commons and in the public domain.
I’d like to continue our discussion of the artificially intelligent (AI) camera with an exploration of how autofocus is accomplished. You start with the view that what my brain is doing is pretty complex and requires great intelligence. Then you break it down in pieces, pieces that can be automated and it seems pretty simple. This is turn leads to the view that what the camera is doing isn’t very intelligent after all. This is really not the correct way to look at it. The autofocusing hardware and software in the modern digital camera is truly AI.
Autofocus is accomplished in two ways. There is the contrast maximization method and the phase method. So the first question that we have to answer, which is the subject of today’s blog is: what is contrast? Take a look at Figure 1. The left hand side is at relatively low

Figure 2 – Histograms of the grey level distributions of the two sides of Figure 1.
contrast, while the right hand side is at higher contrast. This conclusion is based on our visual perception or concept of contrast. It looks to us as if there is a wider distribution of grey scales on the right than the left ,and this is borne out when we look at a histogram of the grey levels in Figure 2. If you’re not familiar with what a histogram is, it is an analysis of how many of the pixels in this case in each of the sides of the image have a particular intensity (or grey level). This is a so-called eight bit image; so there are 256 grey levels with values from 0 (or black) to 255 (or white). We see that there is a much narrower range of grey levels in the low contrast right hand side.
This is what image contrast is conceptually. If we want to put a number on it, which we do if, for instance, we want to quantify it so that we can use the contrast to create an autofocusing mechanism, there are several definitions that we can go with. In common parlance, there are three widely used definitions, Weber, Michaelson, and RMS for root mean square. Each has its uses, disuses, and misuses. But fundamentally, what these definitions do is calculate some representation of the width of the distribution and the average value of the distribution. Contrast is then calculated as the ratio of width over average. If you are interested in the actual mathematical definitions. a good starting point is the Wikipedia site on contrast. The important point is that if you have an array of pixel intensities (Psst, that’s your image) all of these can be calculated in a tiny fraction of a second with appropriate hardwired or software-based programs.
By the way, there is a little paradox to consider here. One of the first things that I do when processing an image is to spread the grey levels of the image over the full range of 0 to 255. If you do that with the low contrast left hand side the result is a much more contrasty image, than if you do that with the high contrast right hand side. This is because the right hand side has intrinsically more contrast and therefore more dynamic range of grey levels. It has more information.