So let’s build on what we know about noise. The operative word for the day is random. Suppose we have a camera sensor and we look at what is happening to a single pixel. Let’s suppose that there are about 100,000 photons of light randomly hitting that pixel every second. The pixel builds up charge in response to the light (which means it converts those photons to electrons and somehow counts them). For now, we’ll assume one photon creates one electron.
OK, now assume that you read the amount of light every microsecond (one millionth of a second). What this means is that most of your microsecond intervals are going to be empty. In fact, only one in ten on average will have photon. Or put another way, the probability that any given microsecond contains a photon is 1/10. By-the-way, this means that the probability of catching two photons in an interval is (1/10)X(1/10) or 1/100 or 1%.
The point is that there is a lot of variability. Because the photons are discrete and their delivery random, you cannot get 0.1 photons in an interval which happens to be the average. Most (~90%) of the time you get 0. Some (~10%) of the time you get 1. And rarely you get 2, 3, 4, etc.
If you instead count for 2 micron intervals, ~80% of the time you get 0 and ~20 % of the time you get 1. The odds of a 2 go up to 2.5%. Basically, the longer the interval the less variability you get. However unless you count for an infinite amount of time there’s always going to be variability.
Here’s the key. Suppose your exposure (that’s your measurement interval) gives you 10,000, then there’s an uncertainty of the square root of 10,000 or 100 in the number of photons detected. OK, I have to say it accurately at least once. The laws of probability predict that if you made your measurement (exposure) a lot of times, 68% of the measurements would fall between 10,000-100 (that’s 9,900) and 10,000 +100 (that’s 10,100). This corresponds to a 1% uncertainty or variability. I’m sorry I had to say it.
The really important take home message here is that ultimately you’re counting photons (really electrons) and there’s always going to be variability, or noise, by virtue of the random way that light is delivered.
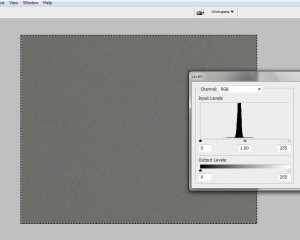
OK, so let’s prove it. In Figure 1, I show a picture that I took of a homogeneous wall. Superimposed on this image is the histogram of the grey values. While they’re tight they’re not all the same. There is variability or noise even in this homogeneous image. Engineers refer to this as counting noise, and it’s inescapable.

