In our exploration of digital camera resolution, we started off with the pixel view and recognized that in order to distinguish two white points or lines there had to be a black point or line in between. This leads to the concept of dots per inch or line pairs per inch. Then we discussed the lens’ point spread function and described Rayleigh’s criterion that two points of light become distinguishable when there is an approximately 20 % dip in between them. This 20 % value was based on the properties of the human eye, and we can argue, in a digital age where the eye is not the primary detector, whether this should still be 20 % or whether a smaller percentage could be detected by our cameras, or more accurately since we know the camera can do better, should the definition of resolution be changed.
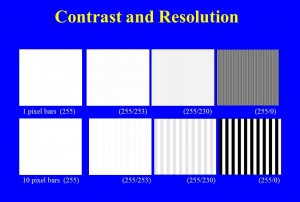
Rather than worry about these semantic issues, let’s accept the view that the dip needs to have some value and see where this concept leads us. In Figure 1, I have computer-generated some images. In the top row of images, I have created a set of alternating one pixel wide vertical lines. In the upper left hand image all of the lines have the same intensity of 255, and, big surprise, they’re not distinguishable, because they’re not different. Moving to the right, in the next image the alternating lines have intensities of 255 and 253. This is only about a 2 % difference. This difference is referred to as: the contrast or the modulation. I’m pretty sure that you won’t be able to see the individual lines. In the next set the lines have a greater contrast or modulation, about 10 %. The values are 255 and 230. Maybe you can just make out the lines or maybe you see this as a uniform grey of average intensity about 242. We’re pushing the resolution limit here! Finally, look what happens if we go to 100% modulation, that is set the alternating intensity values to 255 and 0. The individual lines should be pretty clear now.
Now here’s where things get interesting. In the bottom set I’ve done the same thing, only the vertical lines are ten pixels wide. I think that you will see that even at the 2 % contrast or modulation the individual lines are visible. In general, we see that the larger the separation the less contrast is needed to see the object.
There are two practical aspects of this. First, if you take an image on a cloudy day, objects will be softer. There will be less contrast and sharpness. If you take the same image on a sunny day, objects will be harder or harsher. There will be more contrast and sharpness. Second, if you increase contrast in an image, it appears sharper, often to the point of exaggeration.
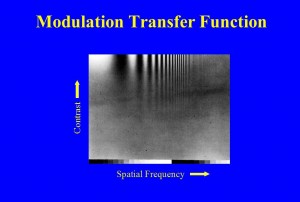
The number of lines per inch or mm is referred to as the spatial frequency. There are other definitions , or more accurately other units, of spatial frequency, such as mm-1 or cycles/mm. But, we don’t need to worry about that now. Spatial frequency enables us to define the fundamental resolution properties of a lens or camera system. This is very vividly shown in Figure 2. Here we have done a similar thing to what we did in Figure 1, with the exception that instead of using lines we use a sine wave that oscillates from some minimum to some maximum, still called the modulation. Spatial frequency increases to the right and contrast increases vertically. Very clearly, we see that to resolve higher and higher spatial frequencies, we need more and more contrast.
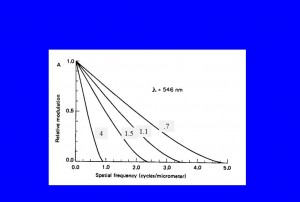
In Figure 3, we see how this data is most usually shown for a lens. This is the so-called modulation transfer function, which defines a lens’ resolution. We suppose perfect modulation a modulation of 100 % or as a fraction 1.0 and consider what modulation the lens or camera delivers. The numbers in the grey boxes are the lens’ f-number. For a given lens, we see how the modulation is reduced more and more, by the lens, as the spatial frequency increases. We also see how the smaller the f-number the better the modulation you get at a given higher spatial frequency. In conclusion, the more modulation, or contrast, you have, the better your resolution.


I think this is really fascinating. Why is the contrast not as good in the last figure of the first row versus the last figure in the second row? Is it the resolution of the eye?
If that is the case how come the sharp transition between black and white is not affected in the last figure of the second row. How come I can clearly see that sharp transition despite the resolution limitations of the eye?
Could you please clarify?
Or do you think this is more due to some pshycological effects in the brain or the way the cells convert these high modulation signals and gets interpreted by the brain or is it an optical illusion effect i.e., the resolution is still bad and if that particular set of pixels where the color transition takes place is magnified we will get similar contrast to that of the figure on the top row.
Very nice discussion on MTF!
Rajan
Rajan,
Let me make sure that I undertand what you are asking. If I blow up the last figure of the top row, I can see the individual bars. However, there appears to be a sinusoidal modulation at a much lower spatial frequency that is confusing things. My first thought on this is that it is an aliasing artefact. The original images were created using Image Pro and I am pretty sure that the sinusoid was not visible there. But here, because of the ImagePro to Powerpoint to Website transition, the individual lines are shifted in registration and alias against the pixels in the final image. I think that as a result as you move from left to right the aliasing samples a given line as more or less black, hence a sinusoid go from black to white in a set of greys.
Is this what you are asking? And what do you think?
David